
Industrial and export agriculture
The agricultural sector is a strategic lever for the economic and social development of Côte d’Ivoire. As the leading provider of jobs and a driver of exports, it contributes to social stability, rural poverty reduction and food security. It accounted for 15.0% of GDP in 2024, compared with 15.2% in 2023.
As for industrial and export agriculture, it occupies an important place in the Ivorian economy, with a contribution to GDP estimated at 8.4% in 2024.
The Government’s overall vision is to promote “ a sustainable and competitive Ivorian agriculture that creates equitably shared wealth ”. In this framework, a first National Agricultural Investment Programme (PNIA), which mobilised CFA francs (FCFA) 1,600 billion out of 2,040 billion, was implemented over the period 2012 – 2017 (PNIA 1), followed by a second programme, PNIA 2, covering the period 2018 – 2025.
PNIA 2, whose cost is estimated at FCFA 12,315 billion in 2024, split between public investment (35%) and private investment (65%), is a key driver of agricultural development and the processing of agricultural products.
The implementation of two National Agricultural Investment Plans (PNIA 1 and 2) has given the sector a clear strategic direction and served as the basis for the agricultural phases of the National Development Plan (PND 2021 - 2025). The development strategy rests on:
grouping the country’s various regions into Agro-Poles on the basis of agro-ecological, administrative, social and economic criteria;
promoting sustainable agriculture.
For about twelve years, the Government has carried out an in-depth reform of agricultural governance in order to modernise the value chains, strengthen transparency and guarantee fairer remuneration for producers.
The State has also strengthened its support to the private sector through structuring financing, such as PURGA 1 & 2 (FCFA 85 billion), and a cost-sharing fund of FCFA 43 billion. This mechanism made it possible to subsidise more than 1 012 projects by private actors (legal entities or individuals), in 2024 to the amount of FCFA 13.2 billion, covering up to 90% of the cost of their investments.
Characterisation of the Agro-Poles
An Agro-Pole is a grouping based on agro-ecological criteria, which allows crops requiring similar climatic conditions to be prioritised in the same zones. It enables producers to benefit from specific government services such as extension services, subsidies and input distribution.
Nine (09) Agro-Poles have thus been identified on the basis of these groupings since 2019. The map below (figure 1) illustrates the proposed zoning and the industrial and export crops concerned (table 1).
To date, two (02) of these Agro-Poles are being implemented with public financing of FCFA 247.4 billion. These are:
Agro-Pole 4 through the Agro-Industrial Poles Project -2PAI-Bélier for an amount of FCFA 80.99 billion;
Agro-Pole 1 through the Agro-Industrial Poles Project -2PAI-Nord for an amount of FCFA 163.81 billion.
These Agro-Industrial Pole Projects (2PAI) have made it possible to mobilise more than 200 million dollars in investment, thereby fostering the emergence of new agro-industrial companies and the creation of jobs. These Agro-Poles, as pillars of PNIA 2, have seen their operations intensify, with an emphasis on crop diversification, farmer training, access to agricultural inputs, storage of products in food-crop collection centres and, above all, the processing of products.
[1] Provisional accounts
[2] Final accounts
Map of the Agro-Poles of Côte d’Ivoire
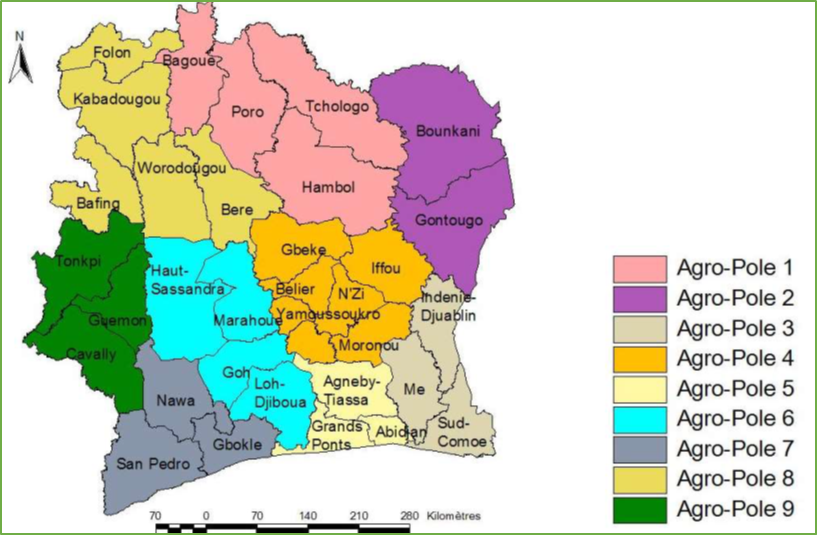
Sources: MEMINADERPV/DSDI
The main industrial and export crops of the Agro-Poles
| Zones | Industrial and export crops concerned | Status |
| Agro-Pole 1 | Cotton, Cashew, Mango, Banana, Sugar cane | Operating under the name 2PAI-Nord |
| Agro-Pole 2 | Cashew | Started in 2025, under the name 2PAI-Nord-Est |
| Agro-Pole 3 | Coffee, Cocoa, Rubber, Oil palm | Financing being sought |
| Agro-Pole 4 | Coffee, Cocoa, Cashew | Operating under the name 2PAI-Bélier |
| Agro-Pole 5 | Rubber, Oil palm, Cocoa | Financing being sought |
| Agro-Pole 6 | Cocoa, Cashew, Citrus fruits | Financing being sought |
| Agro-Pole 7 | Cocoa, Coffee, Rubber, Oil palm | Financing being sought |
| Agro-Pole 8 | Cashew, Cotton | Financing being sought |
| Agro-Pole 9 | Coffee, Cocoa | Financing being sought |
Sources: MEMINADERPV/DSDI
Production of industrial and export crops
The main industrial and export crops are: cocoa, cashew, oil palm, rubber, cotton, banana, pineapple, mango, coffee and sugar cane.
Cocoa and Coffee
The coffee-cocoa pair is an essential pillar of the Ivorian economy. Aware of its leading role in the economy, the Government of Côte d’Ivoire has undertaken a series of reforms, notably the establishment of the
Coffee-Cocoa Council (CCC) as the sole regulatory body of the value chain.
Cocoa
At the end of 2024, Côte d’Ivoire remains the world’s leading producer and exporter of cocoa beans. However, cocoa cultivation is subject to several factors that limited its growth in 2023 and 2024.
After exceeding the two (2) million tonne mark over the period 2017- 2022, thanks to increased yields linked to the introduction of new, more productive varieties and to new plantations coming into production, production stood at 1.82 million tonnes in 2023, down 22.7% from the 2022 peak of 2.36 million. This resulted from unfavourable climatic factors, notably excessive rainfall in the cocoa-growing areas.
However, following the improvement in climatic conditions during the last quarter of 2024, production rose to 1.89 million tonnes, up 3.7% compared with 2023.
Moreover, with a view to promoting remunerative farm-gate prices, Côte d’Ivoire and Ghana have committed to stepping up their cooperation on production since 2021. Accordingly, Côte d’Ivoire wishes to limit its production to two million tonnes. As a result, the government has reduced the distribution of seeds and is combating the development of plantations in classified forests.
The quality of production has improved significantly since 2015 thanks to the control and monitoring system put in place, combined with training of producers in good agricultural practices.
Statistics on cocoa beans
2015 | 2016 | 2017 | 2018 | 2019 | 2020 | 2021 | 2022 | 2023 | 2024 | |
| Production (in thousand tonnes) | 1826,1 | 1634,3 | 2033,5 | 2112,5 | 2235,7 | 2172,7 | 2228,4 | 2358,9 | 1822,4 | 1890,4 |
| Change in % | NC | -10,5% | 24,4% | 3,9% | 5,8% | -2,8% | 2,6% | 5,9% | -22,7% | 3,7% |
Sources: MEMINADERPV; CCC
ND: Not available
NC: Not calculated
- Coffee
Coffee production suffered sharp declines over the period 2015- 2023 due to (i) the poor distribution of rainfall at the time of coffee tree flowering, (ii) the insufficient supply of improved seeds, and (iii) financial difficulties and the ageing of the orchards. It fell from 126 587 tonnes in 2015 to 46 975 in 2023.
However, coffee production recorded growth of 53.6% in 2024 compared with 2023, driven by favourable climatic and agronomic conditions. It should also be emphasised that this crop is cyclical, marked by natural fluctuations in which a high yield may be followed by a decline linked to vegetative rest.
Statistics on coffee
2015 | 2016 | 2017 | 2018 | 2019 | 2020 | 2021 | 2022 | 2023 | 2024 | |
| Production (in thousand tonnes) | 126,1 | 107,6 | 32,6 | 122,6 | 95,2 | 82,4 | 62,2 | 95,5 | 46,9 | 72,21 |
| Change in % | NC | -14,7% | -69,7% | 276,1% | -22,3% | -13,4% | -24,5% | 53,5% | -50,9% | 53,7% |
Sources: MEMINADERPV; CCC
Rubber and oil palm
The rubber and oil palm value chains are important sectors of Ivorian agriculture. These two products hold an important place in industrial activity because they have the highest processing rates among the crops of industrial and export agriculture.
The rubber and oil palm value chains are regulated by the Rubber and Oil Palm Council (CHPH). Since 2025, it has also been entrusted with overseeing the coconut value chain.
Rubber
Côte d’Ivoire is the leading rubber producer in Africa. Over the period 2015-2024, rubber production quadrupled to reach 1.69 million tonnes in 2024 versus 350 309 tonnes in 2015. The value chain benefits from the promotion activities of the Rubber Development Fund (FDH).
The rate of processing of rubber into semi-finished products was 100% until 2015. Since then, with the production “boom”, processing capacities have proved insufficient. As a result, the processing rate fell to 80%, which led operators to set up as buyers of cup lump (wet) rubber for direct export.
To strengthen processing, the Government decided, through Ordinance 2019-826 of 9 October 2019, to introduce specific tax incentives for investments made in the rubber processing sector.
Oil palm
Palm fruit bunch production grew by 2.8% on average per year over the period 2015-2024. However, in 2024, a decline in production of 11.8% was recorded. Similarly, crude palm oil production contracted by 13.4% in 2024.
The value chain benefits from: (i) the provision of improved seedlings to producers on the basis of a subsidy mechanism; (ii) the establishment of a fertiliser financing mechanism for palm fruit bunch producers; (iii) the financing of basic social infrastructure (schools, boreholes, health centres, etc.).
National palm fruit bunch production is entirely processed locally into crude oil by forty-four (44) primary processing units. A second processing stage is carried out locally by the four (4) main industries. The derivative products of this second processing stage are sold on the national market (75%) and on the subregional market - WAEMU zone (25%).
Palm oil production increased by 1.1% on average per year over the period 2015- 2024.
Trends in production of dry rubber, palm fruit bunches and palm oil (in thousand tonnes)
2015 | 2016 | 2017 | 2018 | 2019 | 2020 | 2021 | 2022 | 2023 | 2024 | |
| Dry rubber | 350,3 | 453 | 606,4 | 624,1 | 780,1 | 949,3 | 1100,4 | 1 320,1 | 1624,8 | 1686,6 |
| Palm fruit bunches | 1788,8 | 2018,7 | 2281,6 | 2336 | 2445 | 2346,7 | 2762,6 | 2489,4 | 2 605,7 | 2 298,9 |
| Crude palm oil | 447,2 | 453,2 | 482 | 513,9 | 535,4 | 514,5 | 601,3 | 541,5 | 562,6 | 495,9 |
Sources: MEMINADERPV; CHPH
Cultivated area (in hectares)
2015 | 2016 | 2017 | 2018 | 2019 | 2020 | 2021 | 2022 | 2023 | 2024 | |
| Rubber | ND | ND | ND | ND | 701,5 | 703,7 | 722,5 | 722,5 | 722,5 | 1100 |
| Oil palm | ND | ND | ND | ND | 334,5 | 334,5 | 352, 9 | 352,9 | 352,9 | 352,9 |
Sources: MEMINADERPV; CHPH
Cotton and cashew
Cotton and cashew are grown mainly in the North and Centre of the country. However, cashew is also significantly present in the East. Cotton is an annual crop with a highly developed organisational framework that allows better support for producers. The cashew tree helps combat desert encroachment in the north of the country and has become the main cash crop in this zone. Both value chains are regulated by the Cotton and Cashew Council (CCA). Since 2025, it has also been entrusted with overseeing the shea value chain.
Cotton
Seed cotton production has risen continuously since the 2015/2016 season, going from 310 177 tonnes to 539 623 tonnes in 2021/2022, an increase of 9.7% on average per year over the period. However, in July 2022, attacks by “jassids” (Amrasca biguttula) in the cotton basin caused a 56.2% fall in production in the 2022/ 2023 season, compared with the previous season, to 236 628 tonnes.
A gradual recovery has been observed in the 2023/2024 season, with production up 47.0%.
Over the period 2019-2024, five (05) mechanised agricultural service centres (CPSAM) were established in the cotton-growing areas, notably in Napié (Poro), Mankono (Béré), Boundiali (Bagoué) and Nassian (Tchologo). Each of these centres has at least twenty (20) tractors of 65 to 75 horsepower and suitable equipment.
Cashew
Cashew nut production (or cashew tree nuts) grew by 7.2% on average per year over the period 2015-2023, reaching 1.23 million tonnes in 2023. It benefited from favourable climatic conditions and good agricultural practices that improved orchard yields. However, in 2024, production fell by 0.5% owing to unfavourable climatic conditions in several production areas.
Côte d’Ivoire has been the world’s leading producer of cashew nuts since 2015.
Statistics on seed cotton
2014/2015 | 2015/2016 | 2016/2017 | 2017/2018 | 2018/2019 | 2019/2020 | 2020/2021 | 2021/2022 | 2022/2023 | 2023/2024 | |
| Production (in thousand tonnes) | 450,1 | 310,2 | 328,1 | 412,6 | 469,0 | 490,4 | 559,5 | 539,6 | 236,6 | 347,9 |
| Cultivated area (in thousand ha) | ND | ND | ND | ND | 392,2 | 408,5 | 444,9 | 475,7 | 410,7 | 392,7 |
Sources: MEMINADERPV; CCA
Statistics on cashew nuts
2015 | 2016 | 2017 | 2018 | 2019 | 2020 | 2021 | 2022 | 2023 | 2024 | |
| Production (in thousand tonnes) | 702,5 | 649,6 | 711,2 | 761,3 | 634,6 | 848,7 | 968,7 | 1 028,2 | 1 225,9 | 944,7 |
| Cultivated area (ha) | ND | ND | ND | ND | 1363,5 | 1400,0 | 1407,0 | 1414,0 | 1421,1 | 1428,2 |
Sources: MEMINADERPV; CCA
Fruit crops
Dessert banana is the main fruit export crop of Côte d’Ivoire. It is followed by mango and pineapple. Côte d’Ivoire is the leading African producer of dessert banana and the leading African exporter of mango.
Between 2015 and 2024, production of dessert banana, mango and pineapple recorded average annual rates of (+1.6%), (+9.6%) and (-3.5%) respectively.
Trends in fruit crop production (in thousand tonnes)
2015 | 2016 | 2017 | 2018 | 2019 | 2020 | 2021 | 2022 | 2023 | 2024 provisional | |
| Mango | 79,8 | 100,0 | 120,0 | 120,0 | 120,0 | 120,0 | 180,0 | 180,0 | 180,0 | 198,7 |
| Pineapple | 49,8 | 38,9 | 40,0 | 45,0 | 40,0 | 40,0 | 39,9 | 54,0 | 23,6 | 81,9 |
| Dessert banana | 529,7 | 345,7 | 385,0 | 396,0 | 527,0 | 480,0 | 550,0 | 651,5 | 850 | 442,5 |
Sources: MEMINADERPV/DCPE (Central Organisation of Pineapple and Banana Producers and Exporters (OCAB) ; Organisation of Producers and Exporters of Bananas, Pineapples, Mangoes and other fruits of Côte d'Ivoire (OBAM-CI ).& MEPD/DGE
Outlook
The Government intends to continue and deepen the transformation of the agricultural sector around the following priorities:
Mechanisation, through the establishment of agricultural service centres in all agro-ecological zones;
Modernisation of the cash-crop value chains, through the promotion of sustainable agriculture and the extension of social coverage to all producers;
Land tenure security, with the objective of national coverage of rural land by 2030, with the continued rollout of village committees. Secure access to land is a major issue for social peace and agricultural investment. To this end, the National Strategy (SNSFR) and the National Rural Land Tenure Security Programme (PNSFR) have been updated, with an ambitious objective of covering the national territory by the horizon.
Continuation of inclusive policies on access to finance, land and training for young people and women.
Government interventions will also aim to improve access to quality inputs through the establishment and improvement of seed treatment and preservation infrastructure, as well as the strengthening of the system for controlling the production, marketing and use of inputs.
Reference documents
Strategic orientations PND 2021-2025, Volume 2
PNIA 2 Report, September 2017
PNIA 2 Report, September 2023
Agricultural Statistics Yearbook, 2022-2023 edition
Agricultural Statistics Yearbook, 2024 edition
Macroeconomic framework of April 2025.