
Indicators
Telecommunications service subscriptions
Subscriptions to digital services continue to rise, as shown in particular by the trend in the number of mobile telephony and mobile internet subscriptions. In 2024, the number of mobile subscriptions (active SIM cards) stood at 53 601 479, a penetration rate of 172.2%. As regards mobile internet, 29 171 602 active subscriptions were recorded over the same period, for a penetration rate of 93.7%. These high penetration rates point to strong adoption of digital services, with users often holding several mobile numbers to take advantage of the different offers proposed by operators. These high rates also reflect the dynamism of the Ivorian mobile telephony market, although challenges remain in extending network coverage in rural areas.
Turnover and Investment
The sector continues to make a significant contribution to the Ivorian economy. Substantial revenues are generated each year by telecommunications activities. By way of illustration, the total turnover generated for the 2024 financial year amounted to more than FCFA 1,234 billion, of which more than 80% came from mobile services (mobile voice, mobile internet, SMS). Turnover recorded in 2024 was up 13% compared with 2022, which reflects the dynamism of the telecommunications market.
This sector performance is supported by substantial investments made by operators and digital service providers. In 2024, the total volume of investment made was approximately FCFA 254.38 billion. Over the period from 2016 to 2023, cumulative investment in the sector amounted to more than FCFA 1 700 billion. These investments in infrastructure aim in particular to extend network coverage and to improve the quality of the services provided to the population.
Affordability of telecommunications services:
Price statistics cover three (3) main categories, namely:
Interconnection ceiling rates or wholesale rates;
So-called “advertised” retail rates, communicated by operators or collected from their websites or advertising media;
So-called “observed” retail rates, resulting from users’ actual consumption.
Interconnection ceiling rates
In accordance with the regulations in force, ARTCI has set the wholesale interconnection rates (voice and SMS), also known as call or SMS termination rates, for several years. This is done through a concerted and inclusive process with all mobile telephone operators.
These wholesale rates, revised annually by ARTCI, play a key role in structuring OFF-NET retail service offers (i.e. calls or SMS exchanged between subscribers belonging to different operators), thereby helping to foster healthy competition among players in the sector.
In line with the principle of orienting rates towards actual costs, the interconnection rates set by ARTCI are on a downward trend, mainly because of the downward trend in operators’ network access costs, notably owing to volume effects. This trend is illustrated by the chart below.
Source : ARTCI
Over the period 2020 – 2025, wholesale interconnection rates fell significantly, by 77% for voice and by 87% for SMS.
Average advertised prices
With the marked fall in interconnection ceilings since 2012, operators have gained more economic room in designing their service offers. The business model of the three (3) Ivorian operators has also evolved since 2020.
This new paradigm is characterised in particular by users’ appetite for data service offers and the proliferation of so-called “bundled” offers combining SMS, VOICE (VOIX) and/or DATA services. In addition, innovative offers almost always come with bonuses or discounts, notably because of strong competitive intensity.
Average observed prices
Market reality is reflected by the average prices observed or recorded, which result from users’ actual consumption and incorporate all market effects, including bonuses and promotional offers. These observed prices are therefore the true yardstick for assessing prices and the affordability of services on the market.
For the Voice Service : The average observed price fell from FCFA 10.06/min to FCFA 6.04/min, a decrease of 39.9% between 2020 and the 1st quarter of 2025.
For the SMS Service : The average observed price fell from FCFA 1.32/SMS to FCFA 0.94/SMS, a decrease of 28.9% between 2020 and the 1st quarter of 2025.
For the Mobile Internet Service (Data): The average observed price fell from FCFA 0.80/MB to FCFA 0.33/MB, a decrease of 58.8% between 2020 and the 1st quarter of 2025.
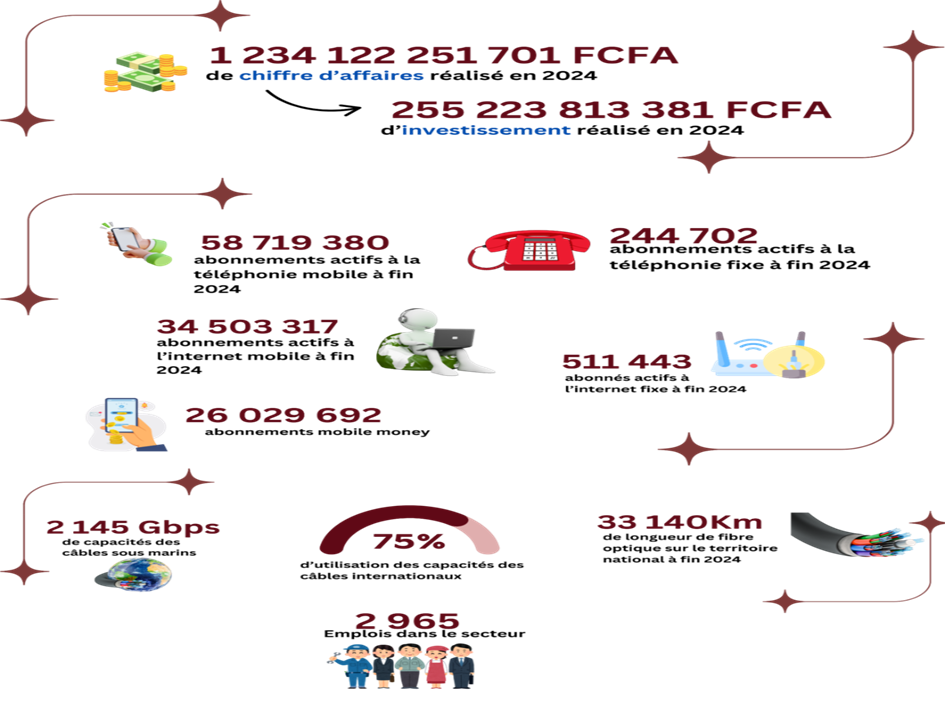
NB: - The number of subscriptions does not correspond to the number of people using these services. It refers instead to the number of active SIM cards (for mobile) and active fixed lines (for fixed telephony).
Active SIM card = SIM that carried out an operation during the 3 months preceding the count.
Data on access and use
To better assess the extent to which Ivorians have adopted digital technology, the Telecommunications/ICT Regulatory Authority of Côte d’Ivoire (ARTCI) regularly conducts a survey known as the Measurement of the Information Society (MSI). This study, carried out according to the international standards of the International Telecommunication Union (ITU/UIT), periodically provides an overview of our country’s digital maturity.
The results of this study make it possible, in particular, to identify and adjust the planning tools for economic and social development policies. The 2023 edition shows that:
Internet access : 74% of Ivorian households have access to the Internet, and most connections are made via smartphones.
Individual use of the Internet : 41% of individuals aged at least 5 years (about 11 million people) use the Internet. Social networks are the main reason for using the internet in Côte d’Ivoire; about 85% of internet users browse social networks.
Access to and adoption of mobile telephones : The mobile phone ownership rate remains very high, with 99% of households and 66% of individuals (about 17.9 million) having a telephone. Use is widespread in all regions, although some rural areas still show a low rate of use.
Frequency of use : The intensity of use of digital technology, and of the internet in particular, varies by age group, place of residence and level of education. Thus, peak use is observed among young people aged between 20 and 35, living in urban areas with an education level of at least secondary school.
Outlook
To support the development of the sector, ARTCI will continue to play its role fully as a Regulator recognised for its sectoral impact and fully meeting the expectations of all stakeholders.
ARTCI will continue to act as the catalyst for a more sovereign, inclusive and innovative information society serving the industrial and economic development of our country. It will ensure agile, inclusive regulation oriented towards value creation for all stakeholders, and guarantee harmonious development in line with the Government’s guidelines.